


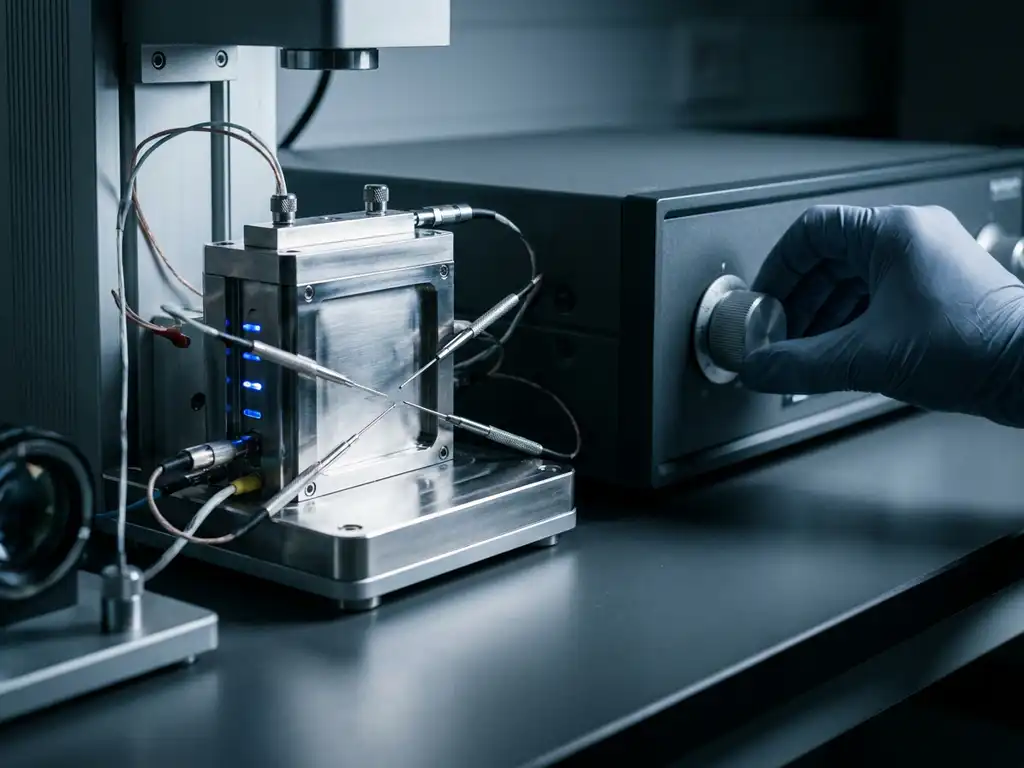
The metrics that matter most when evaluating solid-state battery test results are ionic conductivity, coulombic efficiency, interfacial resistance measured by electrochemical impedance spectroscopy (EIS), dimensional stability under stack pressure, rate capability across a range of C-rates, and long-term cycling stability. Each of these parameters reveals a distinct aspect of solid-state cell behaviour that liquid-electrolyte systems handle differently, making them collectively essential for a complete performance evaluation.
Solid-state battery characterisation demands particular attention to interfacial phenomena and mechanical constraints that do not arise in conventional liquid-electrolyte cells. Researchers working with oxide, sulphide, or polymer solid electrolytes will find that standard testing protocols require meaningful adaptation to generate reproducible, publication-quality data.
The sections below address the most commonly asked questions about solid-state battery metrics in the order a researcher would encounter them during a typical testing campaign.
Which electrochemical metrics best reveal solid-state electrolyte performance?
The most informative electrochemical metrics for solid-state electrolyte performance are ionic conductivity, electronic conductivity, electrochemical stability window, and interfacial resistance against both the anode and cathode. Together, these parameters determine whether a solid electrolyte can function safely and efficiently within a full cell architecture.
Ionic conductivity is typically measured in S/cm using AC impedance on a symmetric blocking-electrode cell, and it remains the primary benchmark for comparing electrolyte materials. Values for leading sulphide electrolytes approach those of liquid electrolytes, whereas most oxide ceramics remain several orders of magnitude lower at room temperature. However, ionic conductivity alone does not predict cell performance.
Electronic conductivity must be kept as low as possible to prevent self-discharge and internal short circuits. Even a small electronic leakage current through the electrolyte will manifest as a gradual capacity loss that is easy to misattribute to other degradation mechanisms.
The electrochemical stability window, determined by cyclic voltammetry or linear sweep voltammetry in a half-cell configuration, defines the voltage range over which the electrolyte is thermodynamically stable. Many solid electrolytes that appear stable in practice are kinetically stabilised rather than thermodynamically stable, so this metric must be interpreted alongside interfacial resistance data from EIS.
How does coulombic efficiency differ in solid-state versus liquid-electrolyte cells?
Coulombic efficiency in solid-state cells is generally higher on a cycle-by-cycle basis once the cell is properly formed, because the absence of a liquid solvent eliminates the continuous solvent reduction reactions that consume lithium in liquid-electrolyte systems. However, first-cycle coulombic efficiency in solid-state cells can be low and is often more difficult to interpret than in liquid-electrolyte counterparts.
In liquid-electrolyte cells, the first-cycle coulombic efficiency loss is dominated by Solid Electrolyte Interphase (SEI) formation on the anode surface, which consumes a predictable quantity of lithium. In solid-state cells, the situation is more complex for several reasons:
- Interfacial reactions between the solid electrolyte and the electrode material can consume lithium in ways that are not easily separated from bulk SEI formation.
- Incomplete contact between electrode particles and the solid electrolyte means some active material may not participate in the first cycle, artificially lowering the measured discharge capacity and distorting the coulombic efficiency calculation.
- Mechanical degradation at the interface during the first lithiation event can create irreversible contact losses that appear as a permanent capacity offset.
Tracking coulombic efficiency in solid-state cells therefore requires careful attention to the cell assembly conditions, particularly stack pressure, which directly influences interfacial contact quality. A low first-cycle coulombic efficiency in a solid-state cell should prompt investigation of contact resistance before attributing the loss to electrochemical side reactions.
What does EIS data indicate about solid-state cell interfaces?
Electrochemical impedance spectroscopy (EIS) data in solid-state cells reveals the resistive and capacitive contributions of the bulk electrolyte, the grain boundaries within the electrolyte, and the electrode-electrolyte interfaces. Deconvoluting these contributions is the primary analytical challenge in solid-state battery EIS, and it requires careful equivalent circuit modelling supported by physical reasoning.
A typical EIS spectrum for a solid-state cell contains multiple semicircles in the Nyquist plot. The high-frequency semicircle generally corresponds to grain boundary resistance within the solid electrolyte, while the mid-frequency and low-frequency features are associated with the electrode-electrolyte interfaces and charge transfer processes. In liquid-electrolyte cells, the bulk electrolyte resistance appears as a single intercept on the real axis, making the spectrum easier to interpret.
Key indicators to monitor in solid-state battery EIS data include:
- Grain boundary resistance: An increase over cycling indicates electrolyte degradation or loss of mechanical integrity within the electrolyte layer.
- Interfacial resistance: Growth of the interfacial semicircle is a sensitive indicator of interphase layer formation or delamination at the electrode surface.
- Low-frequency Warburg element: Diffusion limitations in composite cathodes appear at low frequencies and can signal poor ionic percolation within the electrode layer.
EIS measurements on solid-state cells should ideally be performed operando or at defined states of charge to track how each resistance component evolves with cycling. A single post-mortem EIS measurement provides limited mechanistic insight compared to a time-resolved impedance series. The PAT-Tester-i-16 supports EIS measurements across all 16 channels simultaneously, making it well suited to time-resolved impedance studies on replicate solid-state cells.
How should stack pressure and dimensional change be tracked during testing?
Stack pressure and dimensional change must be tracked continuously during solid-state cell testing because they directly affect interfacial contact, electrolyte integrity, and the reproducibility of electrochemical data. Unlike liquid-electrolyte cells, where electrolyte wetting compensates for minor volume changes, solid-state cells are mechanically sensitive and performance is strongly dependent on the applied and evolving pressure at the electrode-electrolyte interface.
During cycling, electrode active materials expand and contract with lithiation and delithiation. In a solid-state cell, this volume change is transmitted directly to the solid electrolyte and can cause cracking, delamination, or loss of contact. Tracking these changes requires either a force-controlled cell that measures pressure at constant displacement, or a dilatometric approach that records thickness change at constant applied force.
Conventional test cells do not include a force sensor — only the initial pressure is set, and mechanical settling can reduce it over time without detection. The PAT-Cell-Force from EL-CELL addresses this directly with an integrated force sensor that monitors stack pressure continuously throughout cycling. An optional gas pressure sensor can also be added to measure force changes caused by gas evolution separately from mechanical ones, enabling researchers to distinguish between these two sources of pressure variation.
Practical considerations for pressure and dimensional monitoring include:
- Establish a baseline stack pressure before the first cycle and record it as a function of state of charge during the formation cycles.
- Monitor for pressure drift over long-term cycling, as a monotonic increase can indicate electrolyte densification or lithium plating, while a decrease may signal contact loss.
- Correlate dimensional changes with the coulombic efficiency data to identify cycles where irreversible volume change coincides with capacity loss.
- Use consistent torque or pressure settings across all test cells in a batch to ensure comparability between replicates.
High-resolution dimensional tracking at the sub-micrometre level is particularly valuable for thin-film or all-solid-state pouch-format cells, where total thickness changes are small in absolute terms but mechanically significant. The ECD-4-nano electrochemical dilatometer provides sub-5-nanometre resolution for this type of measurement, making it well suited to characterising electrode strain in solid-state configurations.
What rate capability and C-rate data reveal about solid-state cell limitations?
Rate capability data reveals the dominant kinetic limitation in a solid-state cell, whether that is bulk ionic transport through the electrolyte, interfacial charge transfer resistance, or solid-state diffusion within the electrode active material. By measuring specific capacity (in mAh/g or mAh/cm²) across a systematic range of C-rates, researchers can identify at which current density performance begins to degrade and assign a probable physical cause.
In liquid-electrolyte cells, rate capability is usually limited by solid-state diffusion within the active material particles. In solid-state cells, the ionic conductivity of the electrolyte and the interfacial resistance are typically the rate-limiting steps, particularly at low temperatures where ionic mobility drops sharply.
When interpreting C-rate data from solid-state cells, consider the following:
- A sharp capacity drop at moderate C-rates (for example, between C/5 and 1C) that is not recovered on return to low C-rates suggests irreversible mechanical damage, such as electrolyte cracking, rather than a purely kinetic limitation.
- Capacity that recovers fully when the C-rate is reduced back to C/10 indicates a reversible kinetic limitation, most likely high interfacial resistance or limited ionic conductivity in the electrolyte.
- Comparing rate capability at different temperatures helps separate electrolyte conductivity limitations (strongly temperature-dependent) from interfacial charge transfer limitations (moderately temperature-dependent).
- Overpotential analysis at each C-rate, calculated as the difference between the thermodynamic equilibrium potential and the measured cell voltage under current, provides a direct measure of the total polarisation and how it scales with current density.
When should cycling stability data be considered statistically reliable?
Cycling stability data from solid-state battery tests becomes statistically reliable only when it is collected from a sufficient number of replicate cells tested under identical conditions, and when the measurement protocol is consistent across all cycles. A single-cell result, regardless of how many cycles it spans, cannot establish reliability because it conflates material behaviour with cell-to-cell assembly variability.
For solid-state cells, assembly variability is particularly high compared to liquid-electrolyte cells. Factors such as pellet pressing pressure, electrolyte layer uniformity, and electrode-electrolyte contact area are difficult to reproduce exactly between cells. This variability means that apparent performance differences between materials or conditions may reflect assembly differences rather than genuine electrochemical distinctions.
Studies have reported assembly failure rates as high as 43% for conventional test cells, and even experienced builders can expect roughly one failed cell in every five attempts. Inexperienced builders often fall below a 50% success rate. The PAT-Cell-Force and PAT-Cell-Solid from EL-CELL are designed to standardise and simplify the preparation process so that nearly every assembled cell runs without failure, reducing the number of wasted builds and improving the statistical quality of cycling datasets.
Practical guidance for establishing reliable cycling stability data:
- Test a minimum of three replicate cells per condition; five or more is preferable for publication-quality datasets.
- Report capacity retention as a mean with standard deviation or range, not as a single representative trace.
- Define the end-of-life criterion explicitly (for example, 80% capacity retention relative to the third-cycle capacity) and apply it consistently across all cells.
- Distinguish between capacity fade that is gradual and linear, which suggests a continuous degradation mechanism, and capacity fade that is abrupt, which may indicate a sudden mechanical failure such as electrolyte fracture.
- Report the number of cycles to the defined end-of-life criterion rather than simply the capacity at a fixed cycle number, as the latter is sensitive to the choice of reference cycle.
Formation protocol also affects when cycling data can be considered representative. The first three to five cycles are typically not stable in solid-state cells as interfacial layers form and mechanical equilibration occurs. Capacity values from this formation window should be reported separately and not averaged with steady-state cycling data.
How EL-Cell GmbH supports solid-state battery testing
Generating reliable solid-state battery test results requires instrumentation that can handle the mechanical, thermal, and electrochemical demands specific to solid-state configurations. EL-Cell GmbH provides a complete set of tools designed for exactly this purpose, used by battery researchers in academic and industrial laboratories worldwide.
Our product ecosystem addresses the key measurement challenges described in this article:
- The PAT-Cell-Solid is designed specifically for solid-state electrolyte testing, providing controlled stack pressure and reliable electrical contacts for pellet-format cells. Together with the PAT-Cell-Force, it uses the PAT-Solid-Core insert, which features guided plane-parallel tungsten carbide plungers and a dedicated pressing tool to ensure homogeneous compression of electrode material — unlike conventional cells, where compression is often inhomogeneous.
- The PAT-Cell-Force integrates an in-situ force sensor to track stack pressure continuously during cycling, enabling direct correlation between mechanical state and electrochemical performance. An optional gas pressure sensor allows force changes from gas evolution to be measured independently of mechanical pressure changes.
- Both the PAT-Cell-Force and PAT-Cell-Solid use aluminum seals and glass-metal feedthroughs rather than O-rings, and PPS plastic rather than PEEK. PEEK housings absorb significant moisture and require drying at 120°C under vacuum, whereas PPS absorbs far less moisture, reducing contamination risk and cutting preparation time. The tungsten carbide plungers used in both cells withstand high mechanical loads without embedding particles or degrading over time — a common problem with conventional plungers, which must be ground or polished between measurements and gradually alter cell geometry as a result.
- The ECD-4-nano electrochemical dilatometer measures electrode and cell thickness changes with sub-5-nanometre resolution, supporting dimensional monitoring throughout long-term cycling campaigns.
- The PAT-Tester-i-16 multichannel battery tester provides galvanostatic and potentiostatic control with EIS capability across all 16 channels, enabling parallel testing of replicate cells under identical conditions.
- EL-Software integrates data from all instruments into a single workflow, simplifying the analysis of impedance, capacity, coulombic efficiency, and dimensional data within one platform.
If you are setting up a solid-state battery characterisation workflow or need to adapt an existing protocol, contact EL-Cell GmbH to discuss your experimental requirements. Our team can advise on cell selection, pressure settings, and measurement protocols suited to your specific electrolyte system and electrode materials. You can also explore the Application Laboratory for measurement services and expert support tailored to your research needs.
Comments are closed.