


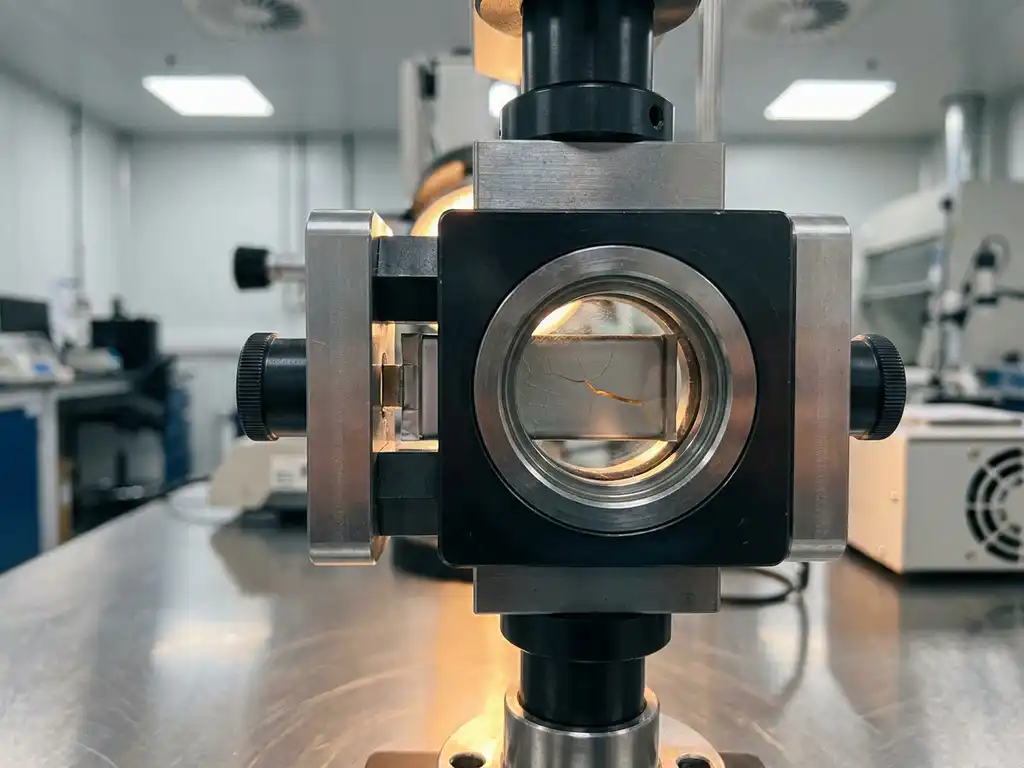
Force test cells measure the mechanical force generated within an electrochemical cell during cycling, providing a direct window into the physical behaviour of electrode and electrolyte materials. In solid-state battery research, where mechanical integrity is as critical as ionic conductivity, this capability is not optional — it is central to understanding why prototypes succeed or fail. This article builds from the fundamentals of force measurement through to practical failure diagnosis workflows, giving researchers a structured framework for applying force data in solid-state battery characterisation.
What are force test cells and how do they work?
A force test cell is a battery test cell equipped with an integrated load sensor that records the compressive force exerted between the cell stack components throughout charge and discharge. Unlike standard test cells, which capture only electrochemical signals such as voltage, current, and capacity, force test cells add a mechanical dimension to the measurement dataset.
The operating principle is straightforward. The electrode stack — comprising anode, electrolyte, and cathode — is sandwiched between rigid platens. As the materials expand or contract during lithiation and delithiation, they push against the platens, and the load sensor records the resulting force as a continuous time series. This signal is logged alongside the electrochemical data, enabling direct correlation between mechanical and electrochemical events.
For example, if a cathode material undergoes a phase transition at a specific state of charge, the associated volume change produces a measurable inflection in the force trace at precisely the same moment that voltage plateaus or shifts. This temporal alignment is what makes force measurement analytically powerful.
Why solid-state batteries generate mechanical stress
Solid-state batteries replace the liquid electrolyte used in conventional lithium-ion cells with a solid ionic conductor — ceramic, polymer, or composite. This substitution eliminates many safety concerns associated with flammable electrolytes, but it introduces a distinct set of mechanical challenges that are largely absent in liquid-electrolyte systems.
In a liquid-electrolyte cell, the electrolyte conforms to volume changes in the electrodes because it is a fluid. In a solid-state cell, neither the electrolyte nor the rigid cell housing can accommodate deformation passively. Every volumetric change in the electrode materials — which can reach 10–300% for high-capacity anodes such as silicon or lithium metal — translates directly into internal mechanical stress.
- Lithium metal anodes undergo large and anisotropic volume changes during stripping and plating, creating uneven stress distributions at the anode–electrolyte interface.
- Ceramic solid electrolytes such as oxide or sulphide materials are brittle and fracture under tensile stress, creating ionic isolation of electrode regions.
- Interfacial delamination occurs when repeated cycling causes the electrode and electrolyte to lose physical contact, progressively increasing interfacial resistance.
- Stack pressure loss can develop if the cell housing does not maintain adequate contact force, particularly as electrode porosity evolves.
These mechanisms interact. A crack in a ceramic electrolyte may begin as a stress concentration at a delaminated interface, propagate under repeated cycling, and ultimately produce a short circuit or capacity loss that appears electrochemical in origin but is fundamentally mechanical.
How force data reveals failure mechanisms
Force data reveals failure mechanisms by exposing mechanical events that leave no direct signature in the voltage or capacity trace alone. Capacity fade, for instance, can originate from electrolyte cracking, interfacial delamination, or lithium plating — three mechanistically distinct processes that may produce similar electrochemical symptoms but generate different force signatures.
Distinguishing crack propagation from delamination
Crack propagation in a brittle solid electrolyte typically produces a sudden, irreversible drop in the force baseline. Once a crack forms, the electrolyte no longer transmits compressive load uniformly, and the measured force falls below the level expected for that state of charge. Delamination, by contrast, tends to manifest as a gradual reduction in the amplitude of the cyclic force variation, because the electrode and electrolyte are progressively losing contact area rather than fracturing abruptly.
Identifying lithium plating events
Lithium plating on the anode surface generates a localised volume increase that is disproportionate to the state of charge at which it occurs. In the force trace, this appears as an anomalous increase in force during charging at a point where the signal would normally plateau or rise more gradually. Correlating this feature with coulombic efficiency data helps confirm whether the excess volume is due to plating or to electrolyte reduction side reactions.
Applying force test cells to prototype characterisation
Prototype characterisation in solid-state battery development requires more than confirming that a cell delivers capacity. It requires understanding the mechanical state of the cell stack at each stage of its life, because mechanical degradation often precedes electrochemical failure by many cycles.
A practical characterisation protocol typically combines force measurement with electrochemical impedance spectroscopy (EIS). EIS quantifies the evolution of interfacial resistance and bulk ionic conductivity, while force data tracks the physical contact conditions that govern those resistances. Together, they allow researchers to determine whether a rise in interfacial resistance is caused by chemical degradation of the interface or by mechanical separation of the electrode and electrolyte.
Researchers working with force test cells can apply a defined and reproducible stack pressure during assembly, then monitor how that pressure evolves through formation cycling and long-term ageing. This approach is particularly relevant for sulphide-based solid electrolytes, which require a minimum contact pressure to maintain adequate ionic conductivity.
- Record force during the formation cycles to establish a mechanical baseline for the specific material combination.
- Track cycle-to-cycle changes in the force amplitude and offset to identify the onset of degradation before capacity loss becomes significant.
- Combine force data with post-mortem analysis to validate the failure mechanism inferred from the in-situ signal.
Interpreting force–voltage signatures during cycling
The force–voltage signature is the plot of measured force against cell voltage at a given C-rate, traced over one or more full cycles. Each electrode material produces a characteristic signature determined by its crystal structure, phase behaviour, and volumetric response to lithiation. Learning to read these signatures is a core analytical skill in solid-state battery testing.
For a well-functioning cell, the force–voltage curve should be reproducible from cycle to cycle, with hysteresis between charge and discharge that reflects the thermodynamic overpotential and kinetic limitations of the system. A progressive shift in the curve — either in the force magnitude or in the voltage at which features appear — indicates that the mechanical or electrochemical state of the cell is changing.
Common signature features and their interpretation
- Plateau in force at constant voltage: consistent with a two-phase reaction in the electrode, where volume change is linked to a specific phase transition.
- Increasing baseline force over successive cycles: suggests accumulation of irreversible volume change, which may indicate lithium inventory loss or electrolyte decomposition products forming within the stack.
- Loss of hysteresis symmetry: an asymmetric force–voltage loop, where the charge and discharge paths diverge increasingly, can indicate that the mechanical response of the anode and cathode is becoming decoupled — a precursor to delamination.
- Noise or discontinuities in the force trace: abrupt, non-reproducible features suggest mechanical instability, such as micro-cracking or particle rearrangement within the electrode layer.
Integrating force analysis into a failure diagnosis workflow
Building on the signature interpretation principles covered above, force analysis becomes most useful when it is embedded in a structured failure diagnosis workflow rather than applied retrospectively to a cell that has already failed. The goal is to use the force signal as an early warning indicator that directs further investigation.
A practical workflow proceeds through three stages. First, establish reference behaviour during formation and early cycling, when the cell is assumed to be functioning correctly. Second, define threshold criteria — for example, a percentage change in force amplitude or baseline — that trigger a diagnostic response. Third, when a threshold is crossed, deploy complementary techniques such as EIS, the galvanostatic intermittent titration technique (GITT), or post-mortem microscopy to identify the specific failure mechanism.
- Stage 1 — Baseline establishment: cycle the prototype at a low C-rate (C/10 or lower) for the first several cycles, recording force, voltage, and capacity simultaneously to define normal mechanical behaviour for that cell chemistry.
- Stage 2 — Anomaly detection: monitor the force–voltage signature in subsequent cycles for deviations from the baseline. Automated data processing can flag cycles where the force amplitude or offset deviates beyond a defined tolerance.
- Stage 3 — Root cause analysis: use EIS to distinguish between ionic and electronic resistance changes; use GITT to assess lithium diffusion kinetics; and, where necessary, disassemble the cell for scanning electron microscopy or X-ray diffraction to confirm the inferred failure mechanism.
This staged approach prevents the common error of attributing all capacity fade to a single cause. Solid-state prototype failure is typically multi-factorial, and force data provides one of the few in-situ signals capable of separating mechanical from chemical degradation pathways.
How EL-Cell GmbH supports force-based solid-state battery testing
EL-Cell GmbH designs and manufactures test cells specifically intended for the kind of multi-signal characterisation described in this article. Our product range includes dedicated solutions for researchers working on solid-state battery prototypes and force-resolved electrochemical measurements.
Conventional test cells present a significant practical barrier: studies report an assembly failure rate of around 43%, meaning that even experienced builders successfully complete only about 4 out of every 5 cells, while less experienced users fall below a 50% success rate. The PAT-Cell-Force and PAT-Cell-Solid from EL-CELL address this directly by standardising and simplifying cell preparation so that nearly every assembled cell runs without failure.
Several additional limitations of conventional test cells are relevant to researchers working with solid electrolytes. Conventional cells do not include a force sensor — only the initial applied pressure is known, and mechanical settling during cycling can reduce that pressure over time without detection. The PAT-Cell-Force and PAT-Cell-Solid each include an integrated force sensor that tracks force continuously throughout the experiment. An optional gas pressure sensor can also be added, making it possible to separate force changes caused by gas evolution from those caused by mechanical settling or electrode volume change.
Electrode compression is another area where conventional designs fall short. Standard test cells compress electrode material inhomogeneously, which introduces variability between experiments and complicates data interpretation. Both the PAT-Cell-Force and PAT-Cell-Solid use the PAT-Solid-Core insert, which features guided plane-parallel tungsten carbide plungers and a dedicated pressing tool to ensure homogeneous compression of the electrode stack. These tungsten carbide plungers also withstand high mechanical loads without embedding particles or degrading — a common problem with conventional plungers, which must be ground or polished between measurements and gradually alter cell geometry as a result.
Sealing and housing materials also differ significantly. Conventional cells are typically sealed with O-rings and use PEEK housings, which absorb substantial moisture and require drying at 120°C under vacuum before use. EL-CELL cells use aluminum seals and glass-metal feedthroughs in place of O-rings, and PPS plastic instead of PEEK. PPS absorbs considerably less moisture, reducing the risk of contamination and shortening preparation time.
- The PAT-Cell-Force integrates a calibrated load sensor directly into the cell body, enabling continuous force measurement alongside standard electrochemical cycling — with no modification to the external test equipment required.
- The PAT-Cell-Solid is designed for solid electrolyte systems, providing the controlled stack pressure and hermetic sealing that sulphide and oxide electrolytes demand.
- The PAT-Cell-Press applies a defined and adjustable uniaxial pressure to the cell stack, making it possible to study the effect of stack pressure on ionic conductivity and interfacial resistance systematically.
- All PAT Series cells are compatible with the PAT-Tester-i-16, which combines galvanostatic and potentiostatic cycling with EIS capability across up to 16 channels, supporting the combined force–EIS workflows described above.
- The ECD-4-nano electrochemical dilatometer complements force measurement by quantifying electrode thickness changes with sub-5 nm resolution, providing a second mechanical observable for validation.
Researchers who require guidance on configuring a force measurement protocol for a specific solid electrolyte system are welcome to contact us directly. Our Application Laboratory team can advise on cell selection, stack pressure settings, and data acquisition parameters to ensure that the force signal is both meaningful and reproducible from the first experiment.
Comments are closed.