


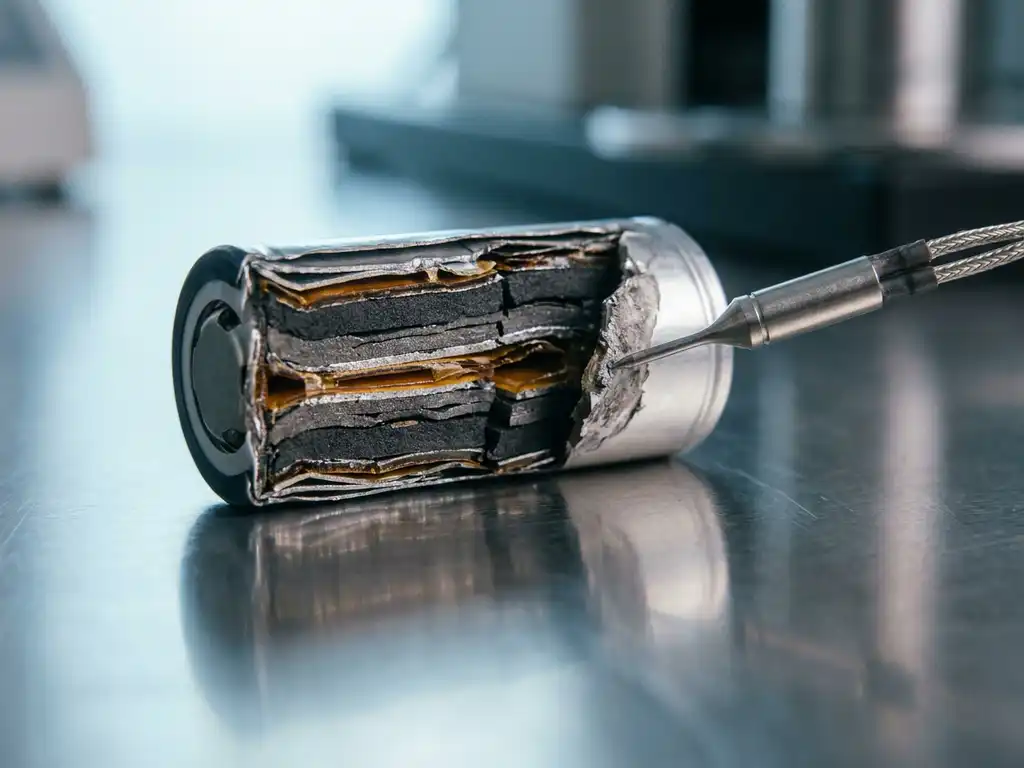
Force distribution data reveals where mechanical stress concentrates within a solid-state battery cell, how that stress evolves with cycling, and which regions are most vulnerable to failure. Unlike conventional liquid-electrolyte cells, solid-state batteries transmit mechanical loads directly through their electrode and electrolyte layers, making spatial force information a direct window into degradation processes. Understanding what this data means, and how to collect it systematically, is increasingly central to solid-state battery research in 2026.
This article builds from the fundamentals of force distribution upward, moving through the degradation mechanisms it governs, the practical appearance of force data, its connection to specific failure modes, and finally its integration with electrochemical measurements. Each concept builds on the last, so readers unfamiliar with mechanical characterisation in battery research will find a clear progression from definition to application.
What is force distribution in solid-state batteries?
Force distribution refers to the spatial variation of compressive or tensile stress across the active area of a solid-state battery cell during operation. Rather than measuring a single bulk pressure value, force distribution characterisation captures how mechanical load is shared, or unevenly concentrated, across different regions of the cell stack.
In a liquid-electrolyte cell, the electrolyte conforms to electrode surfaces and distributes ionic contact relatively uniformly. In a solid-state cell, the electrolyte is a rigid or semi-rigid layer, so any dimensional mismatch between components creates localised stress concentrations that cannot self-correct. This mechanical rigidity is what makes force distribution a uniquely informative measurement for solid-state systems.
For example, if an oxide ceramic electrolyte sits between two electrodes with different volumetric expansion coefficients, the regions where expansion is greatest will bear disproportionately high compressive loads during lithiation. Mapping those loads spatially, rather than averaging them, tells the researcher where contact is being maintained and where it is being lost.
- Uniform force distribution: indicates good interfacial contact across the electrode area and consistent electrochemical activity
- Localised high-force regions: suggest areas of constrained expansion, often associated with cracking or delamination risk
- Localised low-force regions: indicate loss of contact, reduced ionic pathways, and likely underutilised active material
How mechanical stress drives degradation mechanisms
Mechanical stress in solid-state batteries arises primarily from the volumetric changes that electrodes undergo during lithiation and delithiation. These changes are not uniform across a single electrode particle, across the electrode thickness, or across the cell area, and the resulting stress gradients drive several distinct degradation pathways.
Interfacial delamination
When an electrode expands during cycling and the solid electrolyte cannot accommodate that expansion, tensile stress builds at the electrode-electrolyte interface. If this stress exceeds the adhesion strength of the interface, delamination occurs. Delaminated regions lose ionic contact entirely, effectively removing that portion of the electrode from the electrochemical circuit. Capacity fade follows directly, because the active material in delaminated zones can no longer participate in charge storage.
Electrolyte cracking
Ceramic solid electrolytes are brittle. Cyclic compressive and tensile loading, particularly at localised stress concentrations, propagates micro-cracks through the electrolyte layer. These cracks create new surfaces, some of which become electronically connected to the electrode, leading to short-circuit pathways. Even sub-critical cracking that does not immediately short the cell increases ionic resistance and accelerates capacity loss over subsequent cycles.
Lithium metal anode creep and void formation
In cells using a lithium metal anode, the interplay between stripping and plating creates a different mechanical challenge. During stripping, lithium is consumed unevenly, leaving voids at the anode-electrolyte interface. These voids reduce contact area and concentrate current density at the remaining contact points, which in turn accelerates local degradation. The force distribution signature of void formation is a progressive reduction in measured load in specific regions, even while bulk stack pressure appears unchanged.
What force distribution data actually looks like
Force distribution is typically measured using thin-film pressure sensor arrays placed within the cell stack or integrated into a force test cell designed for this purpose. The output is a two-dimensional map of pressure values across the electrode area, recorded at defined intervals during cycling.
In a healthy cell at the beginning of life, the force map is relatively uniform, with modest variation across the active area. As cycling proceeds, the map evolves. Regions of high stress develop at electrode edges, where mechanical constraint is greatest, and at locations corresponding to microstructural heterogeneities in the electrode coating.
The temporal evolution of the force map is equally informative. Key signatures to observe include:
- Reversible force variation: force rises on lithiation and falls on delithiation in a consistent pattern, indicating mechanically stable cycling
- Progressive force increase in localised zones: suggests accumulating irreversible strain, often preceding visible cracking
- Sudden force drops in a region: consistent with delamination or electrolyte fracture events
- Asymmetric force recovery: force does not return to its pre-lithiation baseline, indicating permanent dimensional change or void accumulation
The absolute force values matter less than the spatial gradients and their evolution over cycles. A cell showing a 20% variation in force across its area after 50 cycles warrants closer investigation than one showing the same average force but with uniform distribution.
Linking force signatures to specific failure modes
Building on the degradation mechanisms described above, specific force signatures can be matched to specific failure modes with reasonable confidence when the data is interpreted alongside cell history and post-mortem analysis.
Delamination events typically produce a sharp, spatially localised force drop that does not recover on subsequent cycles. The affected region shows reduced electrochemical activity in any concurrent mapping measurement. Electrolyte cracking, by contrast, often appears as a sudden redistribution of force rather than a net loss, because the cracked electrolyte fragment shifts load to adjacent intact regions. Lithium void formation produces a slower, more diffuse reduction in force across the anode-facing side of the stack, often correlated with rising overpotential in the electrochemical data.
Edge effects deserve particular attention. Electrode edges experience higher mechanical constraint because the surrounding cell hardware restricts free expansion. Force maps consistently show elevated stress at the perimeter of the active area, and this is frequently where the first signs of degradation appear. Recognising this pattern allows researchers to distinguish genuine material failure from an artefact of cell geometry.
- Sharp localised force drop, non-recoverable: delamination
- Force redistribution without net change: electrolyte cracking and fragment displacement
- Gradual diffuse force reduction, anode-side: lithium void formation
- Persistent elevated force at cell perimeter: edge constraint, potential initiation site for further degradation
Integrating force data with electrochemical measurements
Force distribution data gains its greatest interpretive value when recorded simultaneously with electrochemical measurements. The combination allows researchers to establish causal relationships between mechanical events and electrochemical responses, rather than inferring one from the other after the fact.
Electrochemical impedance spectroscopy (EIS) is particularly complementary to force mapping. Interfacial resistance, which EIS quantifies through the charge-transfer resistance component of the impedance spectrum, increases when contact area is lost through delamination or void formation. When a force map shows a localised pressure drop in the same cycle where EIS records a step increase in interfacial resistance, the two measurements together confirm contact loss at that location. Neither measurement alone would be conclusive.
Galvanostatic cycling data adds a third layer. Overpotential, the difference between the thermodynamic electrode potential and the actual potential measured under current, rises when ionic pathways are disrupted. A cell showing progressive overpotential growth, rising interfacial resistance by EIS, and a diffuse force reduction on the anode side presents a coherent picture of advancing void formation. This kind of multi-modal diagnosis is now standard practice in rigorous solid-state battery research.
Practical considerations for integrated measurements include:
- Synchronising force and electrochemical data acquisition to a common timestamp so that transient events can be correlated precisely
- Recording EIS spectra at defined states of charge rather than only at full charge or discharge, to capture impedance evolution across the lithiation window
- Using consistent applied stack pressure between experiments, since force distribution patterns depend on the baseline compressive load applied to the cell
- Separating the contributions of electrode expansion and electrolyte deformation when interpreting force maps, particularly in cells using polymer or composite electrolytes with significant viscoelastic character
The integration of force and electrochemical data also supports more rigorous cycle-life modelling. Mechanical degradation indicators derived from force maps can serve as early warning signals that predict electrochemical performance decline before it becomes measurable in capacity or coulombic efficiency alone.
How EL-Cell GmbH supports force distribution research in solid-state batteries
EL-Cell GmbH designs test cells and instrumentation specifically for the kind of multi-modal, mechanically resolved measurements described in this article. Our product range addresses the practical requirements of solid-state battery testing at the research cell level.
A persistent challenge in solid-state battery research is assembly reliability. Conventional test cells carry a high assembly failure rate — studies cite figures as high as 43%. Even experienced builders achieve only around 4 out of 5 working cells, while less experienced assemblers fall below a 50% success rate. The PAT-Cell-Force and PAT-Cell-Solid from EL-CELL address this directly by standardising and simplifying cell preparation so that nearly every assembled cell runs without failure.
Conventional test cells also present a measurement gap: they do not include a force sensor, meaning only the initial applied pressure is known. Mechanical settling during cycling can reduce that pressure over time without any indication to the researcher. Both the PAT-Cell-Force and PAT-Cell-Solid include an integrated force sensor that tracks force continuously throughout the experiment. An optional gas pressure sensor can be added to isolate force changes caused by gas evolution from those caused by purely mechanical effects — a distinction that is otherwise impossible to make.
Homogeneous compression of electrode material is another area where conventional cells fall short. Standard cell designs compress electrode material inhomogeneously, introducing variability that complicates data interpretation. The PAT-Solid-Core insert, used in both the PAT-Cell-Force and PAT-Cell-Solid, employs guided plane-parallel tungsten carbide plungers and a dedicated pressing tool to ensure homogeneous compression across the electrode area. These tungsten carbide plungers also withstand high mechanical loads without embedding particles or degrading over time — a common problem with conventional plungers, which must be ground or polished between measurements and gradually alter cell geometry as a result.
Sealing and material choices further distinguish EL-CELL test cells from conventional alternatives. Standard cells are typically sealed with O-rings and often use PEEK housings, which absorb significant moisture and require drying at 120°C under vacuum before use. EL-CELL cells use aluminium seals and glass-metal feedthroughs in place of O-rings, and PPS plastic instead of PEEK. PPS absorbs substantially less moisture, reducing both contamination risk and the preparation time required before a cell can be assembled in a controlled environment.
- The PAT-Cell-Force is a dedicated force test cell that measures the force exerted by the electrode stack during cycling, enabling direct correlation between mechanical and electrochemical data within a single, reproducible cell format
- The PAT-Cell-Solid is designed for solid-state electrolyte testing, providing controlled stack pressure and compatibility with ceramic, polymer, and composite electrolyte systems
- The PAT-Tester-i-16 provides up to 16 independent test channels with full potentiostat and galvanostat capability, including EIS, allowing simultaneous mechanical and electrochemical characterisation across multiple cells in a single experiment
- The ECD-4-nano electrochemical dilatometer complements force measurements by quantifying electrode thickness changes with a resolution better than 5 nm, providing a direct measure of volumetric strain at the single-electrode level
All instruments are designed to work together as part of a single, compatible research ecosystem, which simplifies data synchronisation and reduces integration effort in complex multi-modal experiments. If you are developing a solid-state battery testing workflow and want to discuss which combination of instruments fits your experimental requirements, contact the EL-Cell team directly.
Comments are closed.