A cyclic voltammogram is one of the most informative outputs in electrochemical testing, yet interpreting it correctly requires a clear understanding of what each feature represents. For battery materials researchers, the ability to read a cyclic voltammetry (CV) curve accurately is fundamental to characterising electrode behaviour, identifying redox processes, and assessing the long-term stability of the material under investigation.
This article walks through the key questions researchers ask when interpreting CV data, from understanding peak positions to selecting the right test-cell setup for reliable results.
What is a cyclic voltammogram and what does it show?
A cyclic voltammogram is a plot of current response against applied potential as the electrode potential is swept linearly between two set limits and then reversed. It reveals the electrochemical activity of an electrode material, showing where oxidation and reduction reactions occur, how reversible those reactions are, and how much charge is exchanged during each sweep.
In battery research, the cyclic voltammogram provides a direct window into the intercalation, conversion, or alloying reactions taking place at the electrode surface. Each feature on the curve—whether a sharp peak, a broad wave, or a flat baseline—corresponds to a specific electrochemical event. The shape, position, and relative size of these features carry information about thermodynamics, kinetics, and material stability that cannot be obtained from simple charge–discharge cycling alone.
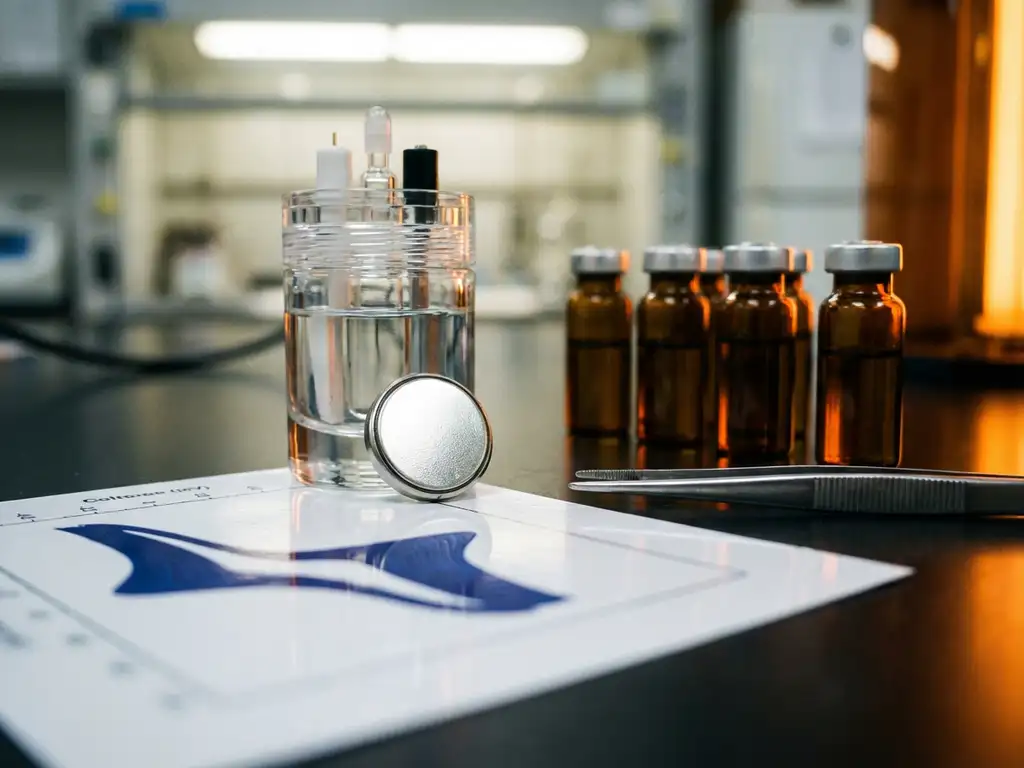
CV is typically performed in a half-cell or full-cell configuration, with the electrode under study acting as the working electrode. In half-cell testing, a reference electrode defines a stable potential baseline, allowing precise attribution of redox events to specific reactions within the material.
What do the peaks in a cyclic voltammogram mean?
Peaks in a cyclic voltammogram correspond to redox reactions at the electrode. An anodic peak (positive current) indicates oxidation, and a cathodic peak (negative current) indicates reduction. In battery electrode materials, these CV peaks typically represent lithium-ion insertion and extraction events or phase transitions within the electrode structure.
The potential at which a peak occurs reflects the thermodynamic driving force of the corresponding reaction. Sharp, well-defined peaks are characteristic of materials that undergo distinct phase transitions, such as lithium iron phosphate (LiFePO4), while broad, sloping peaks suggest solid-solution behaviour, in which lithium is inserted gradually across a range of potentials.
Peak current magnitude is related to the amount of electroactive material participating in the reaction and to the kinetics of the process. A large, symmetric pair of redox peaks generally indicates good electrochemical activity and reversibility. Asymmetry between the anodic and cathodic peaks, or a significant shift in their positions, can signal kinetic limitations or irreversibility.
How does scan rate affect cyclic voltammetry results?
Scan rate directly controls the timescale of the measurement and therefore influences both the shape and position of peaks in a cyclic voltammogram. At low scan rates, the system has more time to reach equilibrium, producing sharper, better-resolved peaks closer to their thermodynamic positions. At high scan rates, kinetic limitations dominate, causing peaks to broaden, shift apart, and sometimes merge.
Varying the scan rate is a deliberate analytical strategy in CV battery research. By measuring peak current as a function of scan rate, researchers can distinguish between diffusion-controlled and capacitive (surface-controlled) charge-storage mechanisms. For a purely diffusion-controlled process, peak current scales with the square root of the scan rate. For a capacitive process, it scales linearly.
Practically, this means that reporting CV data at a single scan rate provides only a partial picture. A systematic scan-rate study, typically spanning at least one order of magnitude, provides a more complete understanding of the rate capability and charge-storage mechanism of the electrode material under investigation.
What’s the difference between a reversible and irreversible CV response?
A reversible CV response shows a matched pair of anodic and cathodic peaks at nearly equal potentials, with a peak separation close to the theoretical value for the number of electrons transferred. An irreversible response shows either a missing return peak, a very large peak separation, or a significant asymmetry in peak currents, indicating that the electrochemical reaction does not proceed equally well in both directions.
In battery electrode materials, full thermodynamic reversibility is rarely achieved in practice, and the term is used comparatively. A material with a small peak-to-peak separation and consistent peak ratios across cycles is considered electrochemically reversible in a practical sense, meaning it can store and release charge efficiently with minimal energy loss per cycle.
Irreversible behaviour, by contrast, points to structural changes, phase decomposition, or side reactions that consume charge without contributing to useful energy storage. Identifying this early in materials characterisation, through careful interpretation of the cyclic voltammogram, can save considerable time before committing to longer-term cycling studies.
How do you identify degradation or side reactions in a CV?
Degradation and side reactions appear in a cyclic voltammogram as new peaks emerging at unexpected potentials, a progressive loss of peak current over successive cycles, increasing peak separation, or the growth of broad background current. Each of these features points to a different underlying process affecting electrode integrity or electrolyte stability.
The solid electrolyte interphase (SEI) layer, which forms on the anode during the first cycles as the electrolyte is reduced at low potentials, often produces an irreversible cathodic peak in the initial CV sweep that is absent in subsequent cycles. Monitoring whether this peak fully disappears or persists can indicate whether SEI formation is complete or ongoing.
- Emerging peaks at new potentials may indicate electrolyte decomposition, current collector corrosion, or the formation of new phases within the electrode material.
- Gradual loss of peak current over many cycles typically reflects active material loss, particle isolation, or binder degradation.
- Increasing peak separation with cycling suggests growing internal resistance, often associated with SEI thickening or contact loss at the electrode interface.
- Rising background current across the potential window points to capacitive contributions from newly formed surface area or ongoing parasitic reactions.
Overlaying multiple CV cycles on the same plot is a straightforward way to track these changes systematically. Any deviation from the initial cycle warrants closer investigation before drawing conclusions about the intrinsic properties of the electrode material.
What test-cell setup gives the most reliable CV data?
The most reliable cyclic voltammetry data come from a three-electrode cell configuration, in which the working electrode, reference electrode, and counter electrode are electrically independent. This setup eliminates the counter-electrode potential from the measurement, ensuring that the recorded response reflects only the working-electrode material under study.
Beyond electrode configuration, several practical factors determine data quality:
- Reference electrode stability: An unstable or contaminated reference electrode introduces potential drift that distorts peak positions and makes cycle-to-cycle comparison unreliable.
- Electrolyte volume and composition: Insufficient electrolyte volume can lead to concentration changes during cycling, shifting peak positions and masking true material behaviour.
- Electrode preparation: Inconsistent electrode coating thickness or mass loading introduces variability that makes it difficult to compare results between experiments or between laboratories.
- Cell geometry: Uniform current distribution across the electrode surface is essential. Non-uniform geometries introduce local variations in reaction rate that broaden peaks and reduce the interpretability of the voltammogram.
Reproducibility is particularly critical for publishable results. A cell design that standardises all of these variables, and that can be assembled consistently by different operators, is a prerequisite for generating CV data that holds up to peer review.
How EL-Cell GmbH supports reliable cyclic voltammetry in battery research
Generating interpretable, reproducible cyclic voltammograms depends on having test hardware that controls the variables described throughout this article. EL-Cell GmbH designs and manufactures electrochemical test cells and instruments specifically for this purpose, with a focus on the standardisation and reproducibility that battery materials researchers require.
- The PAT-Cell supports three-electrode testing with a stable reference-electrode position, enabling accurate attribution of redox events to the working-electrode material without interference from counter-electrode processes.
- The PAT-Tester-i-16 integrates a potentiostat/galvanostat with electrochemical impedance spectroscopy (EIS) capability and a temperature-controlled cell chamber, allowing CV measurements to be performed under precisely defined and reproducible thermal conditions.
- Standardised cell components, including defined electrode geometries and consistent electrolyte volumes, reduce operator-to-operator variability, which is particularly valuable in research groups with high staff turnover.
- EL-Software provides direct control over scan-rate protocols and cycle sequencing, with data export formats suited to further analysis and publication.
If you are setting up or refining a cyclic voltammetry workflow for battery materials characterisation, contact EL-Cell GmbH to discuss which test-cell configuration is best suited to your experimental requirements.
Comments are closed.